In the first of this three part series, I discussed the differences between FFA and CFD software and why the FFA software is better for our analytical needs because we can input an entire fan curve. In part two, I’ll go over the three steps that we use in building ventilation system models in our fluid flow analysis software.
Software
The software we use was originally designed for liquid flow analysis, we had to work with the vendor to make proprietary changes that allow us to use it for air flow analysis. When we started using the software 20 years ago, it was the only FFA software that we know of that would allow entering an enter pump curve which we modified to allow the use of a fan curve.
Based on our experience, we use three steps to model a ventilation system in the software:
- Enter component data;
- Enter fan curve; and
- Make adjustments to achieve desired air flow.
Step 1: Enter Component Data
The first step in building a model is entering the data for each component of the ventilation system that is being modeled. It is important to break the system into separate components when the geometry changes. For example, if there is a large duct transiting to a smaller duct, this should be entered as three separate components: 1) large duct; 2) transition; and 3) smaller duct.
 The key piece of data to be entered for each component is the pressure drop. This is calculated by multiplying the design velocity for the segment by its loss coefficient. For most components, we use two sources to determine the loss coefficient:
- ASHRAE Fitting Loss Coefficients (Fundamentals Edition)
- Handbook of Hydraulic Resistance (by I.E. Idel’chik)
Both of these sources will provide the most reliable loss coefficients so that the model is highly accurate. For unusual component geometries, we have found that combining the factors for two or more test fittings will provide a reliable factor.
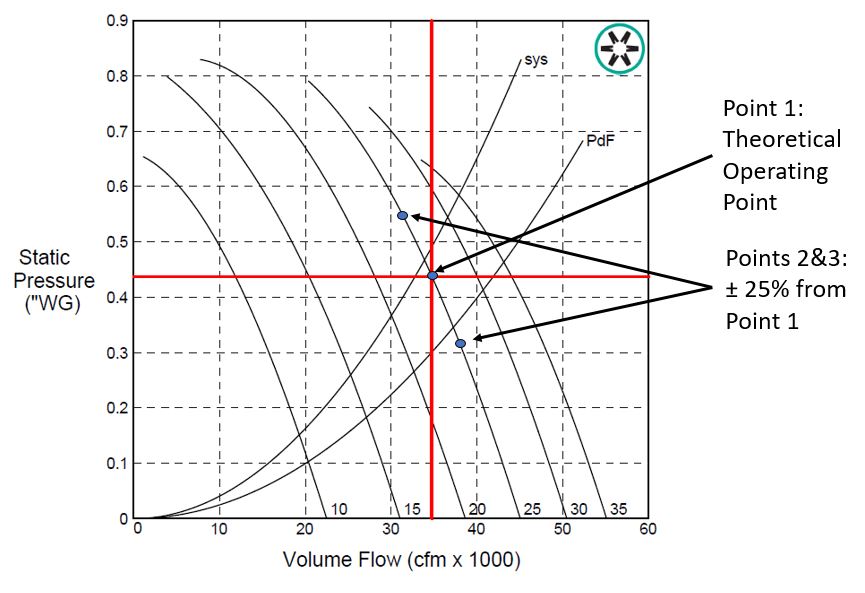
Step 2: Enter Fan Curve
The second step in model building is to enter the fan curve(s). The first point on the curve that we use is the theoretical point where we have determined that the fan will be operating based on the preliminary ventilation system design. The other two points that we enter so that the software can estimate a fan curve will be ± 25% of the static pressure from the first point.
If there is more than one fan in the ventilation system, then we will repeat these steps and enter the curves for the other fans.
Step 3: Make Adjustments
The third and final step is to check the results of the system design in the software. Because the software will dynamically move the fan up or down the curve depending on the system’s geometry, we need to determine that the air flow outputs from the software are what we needed when the system was preliminarily designed.
If we are not getting the required air flow, then we can either modify the system geometry to reduce the static pressure or we can make a new fan selection and in put the new fan curve into the software.
Conclusion
The FFAs that we can perform with our software yield highly accurate results that allow us to guaranty the air flow of even the most complex ventilation system that we design.
In part three of this series on fluid flow analysis, I’ll go through an actual ventilation system design project that we modeled in the software.