If you’ve never worked with a fan curve graph before, it can look intimidating. But don’t fear, it’s actually very straightforward once you break it down. Learning how to read a fan curve will allow you to choose the best fan for the job, as long as the fan is properly tested and certified.
The first thing to note about the fan curve graph is that it has 3 axes:
The fan curve graph actually demonstrates two curves related to the same fan:
CFM VS SP CURVES
The first curve shows the relationship between the static pressure capabilities of the fan compared to the fan’s air volume flow rate.
CFM VS BHP CURVES
The second curve shows the relationship between the fan’s air volume flow rate and the brake horsepower.
HOW TO READ A FAN CURVE
STEP 1 – SELECT YOUR DESIRED CFM
Once you select your CFM, draw a line vertically up to intersect the CFM vs SP Curves that run from lower right to upper left. In our example, we’ve chosen 33,000 CFM, marked with a brown vertical line.
STEP 2 – SELECT YOUR DESIRED SP
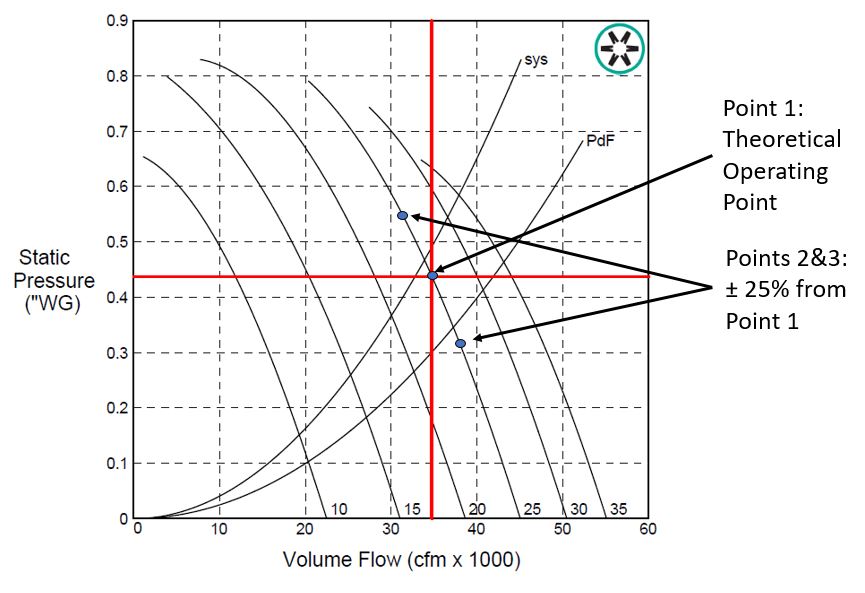
Draw a horizontal line through the vertical left axis at the desired fan pressure to where it intersects the vertical line you just made. In our example, we’ve chosen 1.6 inches wg Static Pressure, marked with a brown horizontal line. If this intersection point happens to fall right on the fan curve you are lucky and you can skip to Step 4. Most of the time the intersection of these two lines are not right on the curve so you will need to calculate and draw a System Curve.
STEP 3 – CALCULATE THE SYSTEM CURVE
The System Curve is something that you can calculate using the Fan Laws.

The System Curve looks kind of like the reverse of the CFM vs SP Curve. It will start at 0 in the lower left hand part of the Fan Curve and then continue upward and to the right in a curving manner. When your System Curve intersects the CFM vs SP curve this is indicative of that fan’s performance when applied to your actual system. (Note: With Adjustable Pitch Fans or Belt Drive Fans that display multiple curves, you can calibrate between the curves for Blade Angle or RPM settings that are not given—see example)
In our example, the orange curve line is manually drawn at the point where the System Curve intersects the desired CFM vs SP point. This orange curve represents the actual fan operating curve, which in this case is midway between the blade pitch angles of 25° and 28°, giving you a blade angle setting of 26.5°.
STEP 4 – DETERMINE MOTOR HORSEPOWER
Draw a vertical line up from the point where the System Curve intersects the CFM vs SP Curve to where it crosses the CFM vs BHP Curve for the blade pitch angle determined previously. In our example, this is demarcated with a green line. The BHP operating point is the manually drawn pink BHP Curve between the 25° and 28° blade pitch angles corresponding to 26.5°—just like its CFM vs SP Curve location. At that intersection draw a horizontal line to the right and read the fan BHP on the vertical right axis. This is the BHP the fan will require to produce the desired CFM and Pressure at the given fan speed and blade pitch angle.
To review, in this example, the desired performance is 33,000 CFM at 1.6 inches wg SP. That point on the CFM vs SP Curve indicated that the blade pitch angle will be 26.5 degrees. Drawing a line up to the CFM vs BHP Curve indicated that this configuration will require 15 BHP to achieve 33,000 CFM. In this scenario, we might recommend a 20 HP motor to provide some future fan performance adjustments if required.
Personally, I like the fan curve to show as much information as possible. I want to know what speeds are available to operate the fan. What happens when I change the blade pitch angle? What is the noise level of the fan at various CFM vs SP points? The fan curve in our example provides some fan noise level information in dBA on the CFM vs SP Curve. Knowing how to read and work with a fan curve can keep you out of trouble when selecting a fan for a specific operating condition.
Eldridge works with this type of data every day. In fact, someone once said that we at Eldridge “study air for a living”. The engineers and technical support team at Eldridge will be glad to help you solve any industrial, marine, or mine ventilation problem you might encounter. Contact us today with your most troublesome ventilation problem for a solution and a quote.