At Eldridge, our passion is solving the most difficult ventilation problems. To do that, we often will use fluid flow analysis (FFA) software to solve for the air flow, pressure and velocity. We have used FFA for simple ventilation systems such as a manufacturing facility as well as for more complex applications such as an engine room of an offshore drilling rig. The benefit of using FFA is that it provides the customer with an accurate model of how the ventilation system that we have designed will solve their problem. In this blog, I’ll go through the process that we use for modeling ventilation systems with fluid flow analysis.
What is FFA?
FFA is the study of the movement of gases or liquids to determine the flow behavior and parameters. For our purposes, we simplify the FFA definition to mean the study of air flow, at standard density, through a ventilation system to determine the parameters of volume, pressure and velocity. By calculating only those three parameters, we can then determine that we have correctly selected all the ventilation system components to make the ventilation system work as designed.
FFA Software
Our software, originally designed for liquid flow analysis, required collaboration with the vendor to implement proprietary modifications for air flow analysis. When we began using this software two decades ago, it was, to our knowledge, the only FFA software that allowed input of an entire pump curve, which we adapted for fan curve use.
Based on our extensive experience, we follow these three steps to model a ventilation system in the software:
- Input component data;
- Enter fan curve(s); and
- Fine-tune to achieve desired airflow.
Step 1: Input Component Data
The initial step in model creation involves entering data for each component of the ventilation system being modeled. It’s crucial to break down the system into separate components when geometry changes occur. For instance, if a large duct transitions to a smaller one, this should be entered as three distinct components: 1) large duct; 2) transition; and 3) smaller duct.
The critical data point for each component is the pressure drop. This is calculated by multiplying the design velocity for the segment by its loss coefficient. We primarily rely on two HVAC industry handbooks for determining loss coefficients. These sources provide the most reliable loss coefficients, ensuring high model accuracy. For unusual component geometrics, we’ve found that combining factors from two or more test fittings yields dependable results.
Step 2: Enter Fan Curve
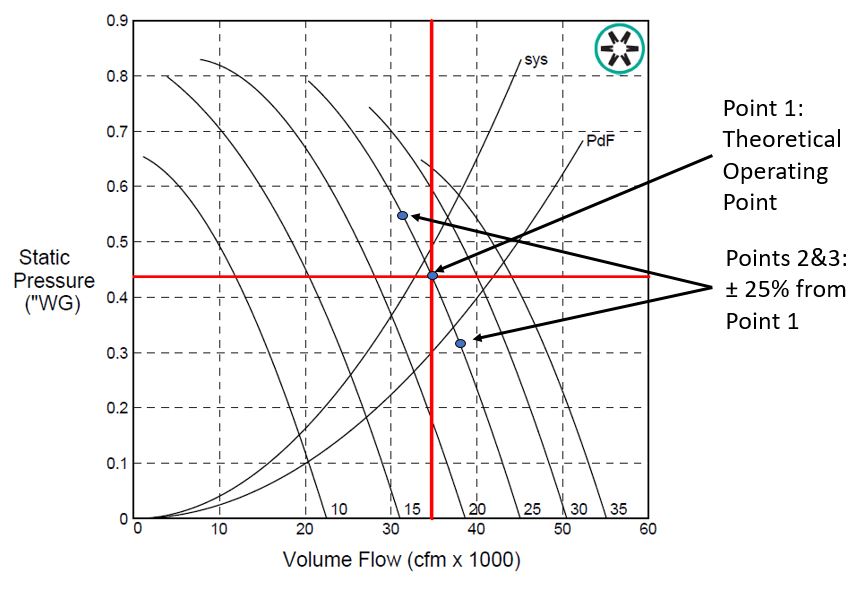
 The second step involves inputting the fan curve(s). We start with the theoretical point where we’ve determined the fan will operate based on the preliminary ventilation system design. The other two points we enter, allowing the software to estimate a fan curve, are ± 25% of the static pressure from the first point.
For systems with multiple fans, we repeat these steps and input curves for each additional fan.
Step 3: Fine-tune
The final step involves checking the system design results in the software. The software dynamically adjusts the fan position on the curve based on system geometry. Because of that, we need to ensure that the airflow outputs match our preliminary design requirements.
If we’re not achieving the required airflow, we can modify the system geometry to reduce static pressure or select a new fan and input its curve into the software.
Conclusion
The FFAs we perform with our software produce highly accurate results. This allows us to guarantee airflow even in the most complex ventilation systems we design.
Whether your ventilation system application is simple or complex, new or retrofit, Eldridge can design and guarantee the right solution by modeling the ventilation system with fluid flow analysis.
