In Part 1: Demistifying Psychrometrics, I provided the scientific definition and a little explanation for the terms used in psychrometrics. In the second part of this series, we will use these terms and learn how to read a psychrometric chart.
Psychrometric Chart
A psychrometric chart packs a tremendous amount of information in an odd looking graph. We will start our exploration by first locating on the graph all of the terms that we learned from my previous article:
- Dry Bulb Temperature: the axis along the bottom
- Humidity Ratio and Vapor Pressure: the right axis
- Saturation Temperature or Dew Point: the curved left axis
- Enthalpy: the slanted left axis
- Relative Humidity: the lines that curve up from left to right
- Wet Bulb Temperature: the lines that slant down from left to right
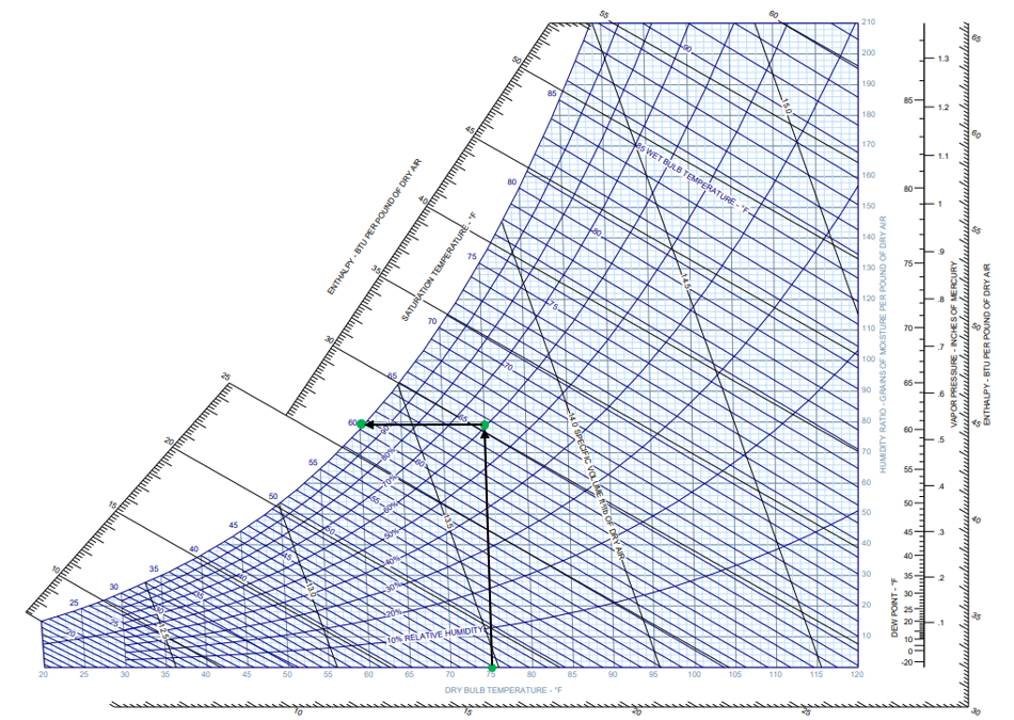
The most important principal of a psychrometric chart is that if you know any two values of the air conditions, you can determine all other parameters. For example, the weather person says that the current air conditions are 75ºF and 60% relative humidity. What if we want to know the Dew Point? To find the spot for current air conditions, start at the bottom axis and find the 75º Dry Bulb Temperature. Next travel up the line at 75º until it intersects with the curved line for 60% Relative Humidity. This is the point of the current air conditions. To determine the Dew Point from these air conditions, move along a horizontal line to the curved left axis. The Dew Point is approximately 60ºF. That means if the outdoor air cools from 75º to 60ºF, it will become saturated and dew will form on outdoor surfaces.
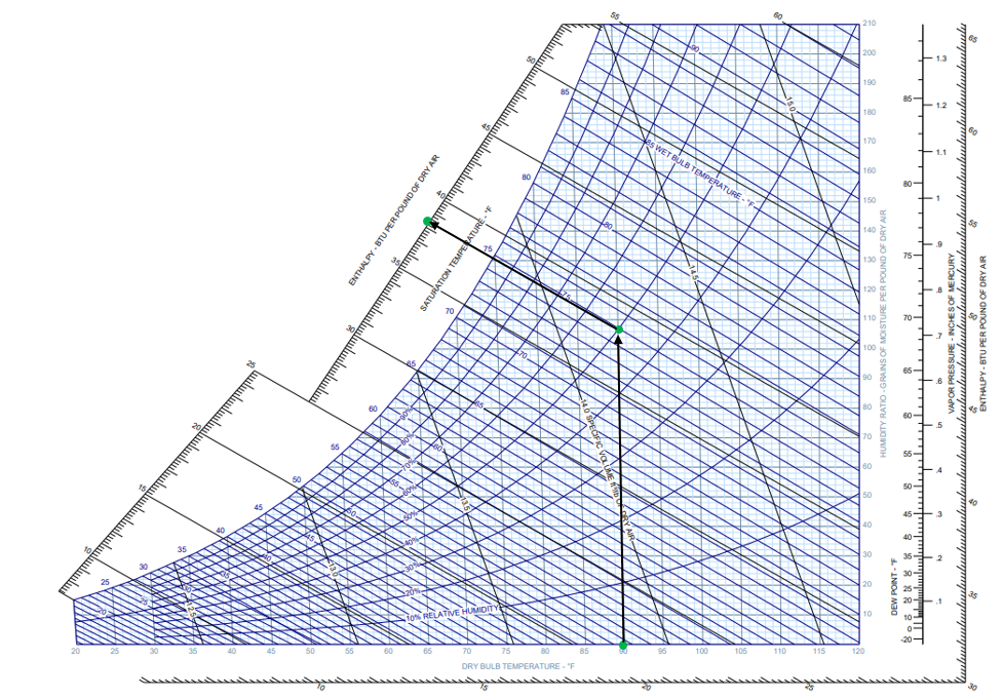
A common use of a psychrometric chart for sizing an air cooling system is to determine the Enthalpy value of the air that needs to be cooled. For this example, let’s assume the current air conditions have a Dry Bulb Temperature of 90ºF and a Wet Bulb Temperature of 75ºF. To find the spot on the chart for the current air conditions, begin again at the bottom axis and find the 90º Dry Bulb Temperature. Now travel up the 90º line until reaching the 75º Wet Bulb Temperature line that is slanting down from left to right. This is the point of the current air conditions. To find the Enthalpy, move along a slanting line parallel to the Enthalpy lines until it crosses the Enthalpy axis. The Enthalpy of the current air conditions is approximately 38 BTUs per pound of dry air.
The two examples above give a good basis to help you in determining other parameters by knowing just two values of the air conditions. Now that you have learned how to read a psychrometric chart, in part three of this series we will put that skill to use on a couple of real HVAC applications.